2012 Press Releases-Nevsun Announces Increased Base Metals Reserves
July 24, 2012
In order to read the table and see the map clearly, click this link:
http://www.nevsun.com/news/2012/july24/
HIGHLIGHTS
* 4.09% copper grade in supergene ore reserves estimate
* 6.33% zinc grade in primary ore reserves estimate
* Total contained copper in probable reserves increased by 6%
* Total contained zinc in probable reserves increased by 38%
<
http://www.nevsun.com/> Nevsun Resources Ltd. (TSX: NSU / NYSE MKT: NSU)
(the "Company or "Nevsun") today announced new increased base metal Canadian
National Instrument 43-101 ("NI 43-101") compliant mineral resources and
reserves estimates at its 60%-owned
<
http://www.nevsun.com/projects/bisha-main/configuration/> Bisha Mine
("Bisha") in Eritrea. Expressed as contained metal, the
<
http://www.nevsun.com/projects/bisha-main/copper-expansion/> copper
reserves estimate is 6% higher and the zinc reserves estimate is 38% higher
as of May 31, 2012, compared with the previous reserves estimate effective
date January 1, 2011. Management will hold a conference call on Tuesday,
July 24, 2012 to discuss the results (details below).
Total mineral reserves estimate consists of 26.5 million tonnes with the
oxide portions grading 5.79 gram per tonne ("g/t") gold for a total of
167,000 troy ounces of gold, the supergene portions grading 4.09% copper for
a total of 579 million pounds of copper, and the primary portions grading
1.09% copper and 6.33% zinc for a total of 462 million pounds of copper and
2,680 million pounds of zinc respectively. A tabulation of total mineral
resources and mineral reserves by classification is appended at the end of
this <
http://www.nevsun.com/news/2012/> news release.
The new resources and reserves estimates resulted from 27,000 meters of
diamond drilling in 2011 and from adjustments to the mine plan based on the
new resource model. The reserves estimate underscores the fact that the
Bisha Mine is one of the highest grade open pit base metals deposits in the
world.
Nevsun intends to continue drilling while re-starting generative exploration
in 2012 with the objective of further increasing reserves and extending the
mine life at Bisha. An approximately 8,000 meters diamond drilling program
is progressing at the <
http://www.nevsun.com/projects/nwzone/> Northwest
Zone which is 1.5 km from the existing Bisha Main pit.
Nevsun expects base metals production at Bisha to commence in mid-2013 and
continue until 2024. The Mine has been producing gold since 2011 but, as
previously disclosed, management currently expects Bisha to complete oxide
gold production in the first quarter of 2013. This new mineral reserves
estimate predicts 167,000 ounces of remaining oxide gold reserves (900 kt _at_
5.78 g/t) as of May 31, 2012. Based on the 2012 guidance and this reserves
estimate, management expects between 30,000 and 50,000 payable ounces of
oxide gold would remain to be mined in Q1 2013.
Nevsun reiterates forecast full year 2012 gold production guidance of
240,000 to 260,000 ounces and management intends to re-evaluate this
guidance in August when reviewing the full quarter financial results with
the added benefit of observing actual mining results for the month of July.
As part of the mineral resources and reserves estimation review, the Company
retained AGP Mining Consultants Inc. ("AGP"), an independent mining and
geological consulting firm that had not previously reported on the property.
AGP estimated the new mineral resources at Bisha. AGP's estimate was in turn
reviewed by an independent third party engineering company. AMEC Americas
Limited estimated the new mineral resources at Harena. AGP also prepared the
new combined Bisha and Harena mineral reserves estimate. An NI 43-101
technical report will be filed within 45 days on SEDAR.
Table 1: Summary Base Metals (Not Including Oxides) Mineral Reserves
Estimate Comparison (1)
Effective May 31 2012 (2) (4)
Effective Jan 1, 2011(3) (4)
Change
Supergene + Primary Ore (Mt)
25.6
23.7
+8%
Supergene Cu grade (%)
4.09
3.90
+5%
Primary Cu grade (%)
1.09
0.97
+13%
Primary Zn grade (%)
6.33
5.40
+17%
Total Cu contained metal, lbs
1,040,000,000
982,000,000
+6%
Total Zn contained metal, lbs
2,680,000,000
1,937,000,000
+38%
* (1) See detailed mineral reserves (table 4) below for further
information on zones, cut-offs and other relevant data. All mineral reserves
shown are in the probable category.
* (2) Bisha Main pit (including Hanging Wall) and Harena pit. All
mineral reserves in the probable category.
* (3) Original Bisha Main only. Excludes Hanging Wall, Harena and 2011
infill drilling. Mineral reserves are proven and probable. See news release
and the related NI 43-101 technical report dated March 28, 2011 filed on
SEDAR for details.
* (4) Metals prices per lb for reserves estimate: Copper - US$2.80 in
2012 vs US$2.40 in 2011 and Zinc - US$0.92 in 2012 vs US$0.92 in 2011.
Table 2: Payable Production Profile Projections (100% Project Basis)
The following production profile was developed by AGP as a possible
scenario, without optimizing the mine plan, and, compared to previous
production profiles, would result in accelerating the timing of zinc
expansion capital. Optimization work, which the Company intends to perform
over the remainder of the year, is required before the Company decides on
whether to accelerate zinc expansion.
Year
2012(1)
2013
2014
2015
2016
2017
2018
2019
2020
2021
2022
2023
2024
Oxide Phase
Supergene Phase
Supergene & Primary Overlap(3)
Primary Phase (2)
Gold
146,000 oz
36,000 oz
32,000 oz
Silver
221,000 oz
1,600,000 oz
1,560,000 oz
6,940,000 oz
Copper
317 Mlbs
242 Mlbs
301 Mlbs
Zinc
146 Mlbs
1,740 Mlbs
* (1) From May 31, 2012. Total gold production in 2012 is forecast at
240,000 to 260,000 ounces including Harena oxides. It is anticipated that
the Oxide Phase will extend through Q1 2013, when the gold plant will be
shutdown to commence supergene phase commissioning.
* (2) Includes Harena sulphides.
* (3) The mine plan for the purposes of reserves determination
contemplates a period of co-processing supergene and primary ores but Bisha
has not made a final determination on this approach. Bisha will continue to
evaluate and will advise if and when the approach is adopted.
Table 3: Estimated Bisha Net Financial Impact (100% Project Basis in USD)
The net impact of the above production profile, and other mine plan changes
on the Bisha Project cash flow, on a go-forward basis, is demonstrated below
using different metals prices. These are all on an after-tax, royalty and
CAPEX basis:
Sensitivity Scenarios
Net Future Cash
$ billions (1)
NPV (8%)
$ billions
Metals Prices Used
High metals price case
$ 2.536
$ 1.620
$1,800/oz Au; $36.00/oz Ag; $4.00/lb Cu; $1.25/lb Zn
Medium metals price case
$ 1.608
$ 1.030
$1,500/oz Au; $24.00/oz Ag; $3.00/lb Cu; $1.00/lb Zn
Reserve metals price case
$ 1.319
$ 0.839
$1,175/oz Au; $22.00/oz Ag; $2.80/lb Cu; $0.92/lb Zn
* (1) Net future cash flow is undiscounted after tax from 2012
onwards, and after all expansion and sustaining capital for 100% of the
Bisha Project. Nevsun owns 60% of the Bisha Project and also has a
receivable from the Eritrean State mining company related to its 30%
purchased interest.
Conference Call Details
The Company will hold a conference call on Tuesday, July 24, 2012 at 8AM
Vancouver / 11AM Toronto, New York / 4PM London, to discuss the quarterly
results. Dial in details are as follows:
North America: 416-695-6622 / 1-800-766-6630
UK: 00800-4222-8835 (Toll Free)
Other International: +1 416-695-6622
The conference call will be available for replay until August 6, 2012 by
calling +1 905-694-9451 / 1 800-408-3053 and entering passcode 3153642.
Qualified Persons Statement
All mineral resources and mineral reserves estimates in this report have
been prepared by the Qualified Persons described below in accordance with
Canadian National Instrument 43-101 - Standards of Disclosure for Mineral
Projects and the Canadian Institute of Mining, Metallurgy and Petroleum's
Classification System (CIM Definition Standards for Mineral Resources and
Mineral Reserves 2010).
The information in this press release that relates to Mineral Resources was
prepared by Michael Waldegger, P.Geo. of AGP Mining Consultants Inc. for
Bisha and by David Thomas, P.Geo. of AMEC Americas Limited for Harena. The
information in this report that relates to Mineral Reserves was prepared by
Jay Melnyk P.Eng. of AGP Mining Consultants Inc.
Darin Wasylik, P.Geo. and Frazer Bourchier, P.Eng. are Nevsun's designated
Qualified Persons and have reviewed and approved the contents of this press
release.
Sample preparation and analysis was done by ALS Chemex in Vancouver, Canada.
Cautionary Notes to Investors - Reserve and Resource Estimates
In accordance with applicable Canadian securities regulatory requirements,
all mineral reserve and mineral resource estimates of the Company disclosed
or incorporated by reference in this news release have been prepared in
accordance with Canadian National Instrument 43-101 - Standards of
Disclosure for Mineral Projects ("NI 43-101"), classified in accordance with
Canadian Institute of Mining Metallurgy and Petroleum's "CIM Standards on
Mineral Resources and Reserves Definitions and Guidelines" (the "CIM
Guidelines"). The definitions of mineral reserves and mineral resources are
set out in our disclosure of our mineral reserve and mineral resource
estimates in our Annual Information Form.
The Company uses the terms "mineral resources", "measured mineral
resources", "indicated mineral resources" and "inferred mineral resources".
While those terms are recognized by Canadian securities regulatory
authorities, they are not recognized by the United States Securities and
Exchange Commission (the "SEC") and the SEC does not permit U.S. companies
to disclose resources in their filings with the SEC.
Pursuant to the CIM Guidelines, mineral resources have a higher degree of
uncertainty than mineral reserves as to their existence as well as their
economic and legal feasibility. Inferred mineral resources, when compared
with measured or indicated mineral resources, have the least certainty as to
their existence, and it cannot be assumed that all or any part of an
inferred mineral resource will be upgraded to an indicated or measured
mineral resource as a result of continued exploration. Pursuant to NI
43-101, inferred mineral resources may not form the basis of any economic
analysis, including any feasibility study. Accordingly, readers are
cautioned not to assume that all or any part of a mineral resource exists,
will ever be converted into a mineral reserve, or is or will ever be
economically or legally mineable or recovered.
Forward Looking Statements
The above contains forward-looking statements regarding increases in
estimated grade and mineral resources and reserves, future production
profiles, and the effect of future production profiles on future cash flows
and net present value. Forward-looking statements are frequently, but not
always, identified by words such as "expects," "anticipates," "believes,"
"intends," "estimated," "potential," "possible" and similar expressions, or
statements that events, conditions or results "will," "may," "could" or
"should" occur or be achieved. Information concerning the interpretation of
drill results and mineral resource and reserve estimates also may be deemed
to be forward-looking statements, as such information constitutes a
prediction of what mineralization might be found to be present if and when a
project is actually developed. Forward-looking statements are statements
about the future and are inherently uncertain, and actual achievements of
the Company or other future events or conditions may differ materially from
those reflected in the forward-looking statements due to a variety of risks,
uncertainties and other factors, including, without limitation, the risks
that (i) any of the assumptions on which the Company's revised resource and
reserve estimates are based turn out to be incorrect, incomplete, or flawed
in any respect; (ii) the methodologies and models used to prepare the
resource and reserve estimates either underestimate or overestimate the
resources or reserves due to hidden or unknown conditions, (iii) the mine
operations are disrupted or suspended due to acts of god, internal conflicts
in the country of Eritrea, or unforeseen government actions; (iv) the
Company experiences the loss of key personnel; (v) the mine operations are
adversely affected by other political or military, or terrorist activities;
(vi) the Company becomes involved in any material disputes with any of its
key business partners, lenders, suppliers or customers; (vii) the Company is
subjected to any hostile takeover or other unsolicited attempts to acquire
control of the Company; (viii) the Company is subject to any adverse ruling
in any of the pending litigation to which it is a party; or (ix) the Company
incurs unanticipated costs as a result of the transition from the oxide
phase of the Bisha mining operations to the copper phase in 2012. Other
risks are more fully described in the Company's most recent Management
Discussion and Analysis, which is incorporated herein by reference. The
Company's forward-looking statements are based on the beliefs, expectations
and opinions of management on the date the statements are made and the
Company assumes no obligation to update such forward-looking statements in
the future, except as required by law. For the reasons set forth above,
investors should not place undue reliance on forward-looking statements.
Please see the Company's Annual Information Form for the fiscal year ended
December 31, 2011 and the Company's Management Discussion and Analysis for
the quarter ended March 31, 2012 for a more complete discussion of the risk
factors associated with our business.
About Nevsun Resources Ltd.
Nevsun Resources Ltd. is a Vancouver-based mining company with an operating
mine in Eritrea. Nevsun's 60%-owned Bisha Mine commenced gold production in
February 2011 and is scheduled to transition to copper/gold production in
2013. Management expects the Bisha Mine will rank as one of the highest
grade open pit base metal deposits in the world.
NEVSUN RESOURCES LTD.
Cliff T. Davis
President & Chief Executive Officer
For further information, please contact:
Kin Communications
Tel: 604 684 6730
Toll free 1 866 684 6730
Email: <mailto:nsu_at_kincommunications.com> nsu_at_kincommunications.com
Website: <
http://www.nevsun.com/> www.nevsun.com
Table 4: Bisha Mineral Reserves Estimate (Combined Bisha & Harena),
Jay Melnyk, P.Eng, Effective Date: May 31, 2012
Probable
Contained Metal
Zone
Tonnes
('000's)
Copper
%
Zinc
%
Gold
g/t
Silver
g/t
Cu
('000 lbs)
Zn
('000 lbs)
Au
('000 Oz)
Ag
('000 Oz)
Oxide Phase
900
5.79
35
-
-
167
1,020
Supergene Phase
6,420
4.09
0.67
28
578,880
-
138
5,780
Primary Phase
19,190
1.09
6.33
0.72
47
461,540
2,679,500
441
28,950
Total
1,040,420
2,679,500
746
35,750
The following notes should be read in conjunction with the table 4 above:
* (1) NSR Cut-Off ($US/t): Oxide Phase $46.42 for Bisha and $48.92 for
Harena; Supergene Phase $35.29 for Bisha; and Primary Phase $35.29 for Bisha
and $37.79 for Harena. Mineral reserves are defined within a mine plan, with
pit phase designs guided by Lerchs-Grossmann (LG) pit shells and generated
using metal prices for copper, zinc, gold and silver of $2.80/lb, $0.92/lb,
$1175/oz, $22/oz respectively. The mining cost was $2.08/t, plus $0.01/t/5 m
bench for ore and $0.02/t/5 m bench for waste below the reference elevations
of 540 meters above mean sea level and 600 meters above mean sea level for
Bisha and Harena respectively. The total ore based costs (process, G&A and
stockpile re-handle) are $46.42/t for oxide, and $35.29/t for supergene and
primary ores. Harena ore based costs include an additional $2.50/t overland
ore haulage cost. Overall pit slopes varied from 34.5° to 44° for Bisha and
from 29° to 35.5° for Harena.
* (2) Economic values for the multi-metal, multi-zone deposits were
modeled using Net Smelter Return values. For each block, NSR values were
calculated using diluted indicated grades, metal prices, recoveries and
appropriate smelter terms and downstream costs. Metallurgical recoveries,
supported by metallurgical test work, were applied as follows:
a. Bisha oxide zone: recoveries of 88% and 22% were applied for gold and
silver respectively, based on actual production. Copper and zinc are not
recovered during the oxide phase and therefore are not considered a part of
the oxide mineral reserves.
b. Harena oxide zone: a recovery of 75% was applied for gold. Test work
was not performed to support a silver recovery. Copper and zinc are not
recovered during the oxide phase and therefore are not considered a part of
the oxide mineral reserves.
c. Bisha supergene zone: recoveries of 88%, 56%, and 54% were applied for
copper, gold and silver respectively. Zinc has not been assigned a recovery
as most of the supergene zone will be processed prior to start-up of the
zinc flotation plant. An arsenic recovery of 67.5% was applied for smelter
penalty inclusion in the NSR calculation and cash flow analysis.
d. Bisha hanging wall zone: recoveries of 88%, 56%, and 54% were applied
for copper, gold and silver respectively. Zinc has not been assigned a
metallurgical recovery as most of this zone will be processed prior to
start-up of the zinc flotation plant.
e. Bisha primary zone: recoveries to copper concentrate of 85%, 36%, and
29%, were applied for copper, gold and silver respectively. Recoveries to
zinc concentrate of 83.5%, 9% and 20% were applied for zinc, gold and silver
respectively. Due to uncertainty whether candidate zinc smelters will pay
gold and silver credits, they have been disregarded for cash flow estimates.
e. Harena primary zone: recoveries to copper concentrate of 85%, 36%, and
29%, were applied for copper, gold and silver respectively. A zinc recovery
of 72% to zinc concentrate was applied. Gold and silver recoveries to zinc
concentrate were not available at the time of analysis.
* (3) Mineral reserves are reported within the Bisha and Harena
ultimate pit designs, using the NSR block grade, where the marginal cut-off
is the total ore based cost stated above. Tonnages are rounded to the
nearest 10,000 tonnes and grades are rounded to two decimal places with the
exception of silver which was rounded to zero decimal places.
* (4) Rounding as required by reporting guidelines may result in
apparent summation differences between tonnes, grade and contained metal
content.
* (5) Tonnage and grade measurements are in metric units. Contained
gold and silver ounces are reported as troy ounces, contained copper and
zinc pounds as imperial pounds.
* (6) The life of mine strip ratios for Bisha and Harena are 6.5:1 and
10.2:1 respectively.
* (7) The Bisha probable mineral reserves for oxide material are
inclusive of 284 kt at 4.69 g/t Au in stockpile as of 31 May 2012.
Table 5: Bisha Mineral Resources Estimate
Mineral resources that are not mineral reserves do not have demonstrated
economic viability.
Michael Waldegger, P.Geo., Effective Date: May 31, 2012
Indicated
Contained Metal
Zone
NSR Cut-Off
($/t)
Tonnes
('000's)
Copper
%
Zinc
%
Gold
g/t
Silver
g/t
Cu
('000 lbs)
Zn
('000 lbs)
Au
('000 Oz)
Ag
('000 Oz)
Oxide Phase
46.42
740
6.08
43
-
-
145
1,020
Supergene Phase
35.29
8,000
3.75
0.72
28
661,390
-
185
7,200
Primary Phase
35.29
21,150
0.96
6.47
0.71
47
447,630
3,016,810
483
31,960
Total
1,109,020
3,016,810
813
40,180
Inferred
Contained Metal
Zone
Tonnes
('000's)
Copper
%
Zinc
%
Gold
g/t
Silver
g/t
Cu
('000 lbs)
Zn
('000 lbs)
Au
('000 Oz)
Ag
('000 Oz)
Oxide Phase
46.42
330
5.31
111
-
-
56
1,180
Supergene Phase
35.29
300
1.73
0.19
5
11,440
-
2
50
Primary Phase
35.29
1,000
1.06
9.58
0.76
59
23,370
211,200
24
1,900
Total
34,810
211,200
82
3,130
The following notes should be read in conjunction with table 5 above:
* (1) Domains were modeled in 3D to separate oxide, supergene and
primary massive sulphide rock types from surrounding waste rock. The domains
conformed to lithological contacts logged in diamond drill core and reverse
circulation chips. Sub-domaining was further warranted to separate different
grade populations within domains. The mined out portion of the oxide domain
was also modeled, using an extensive grade control dataset.
* (2) Raw drill hole assays were composited to 2.5m lengths
interrupted by domain boundaries.
* (3) Block grades for copper, zinc, gold and silver, as well as lead
and arsenic were estimated from the composites using a combination of
ordinary kriging (OK) and inverse distance weighted to the second power
(ID2) into 5 x 5 x 5m blocks coded by domain. Blocks in the Oxide domain
were estimated using grade control sample dataset as well as the drill hole
dataset. All other domains used only the drill hole dataset.
* (4) Restrictive search distances were applied to high grade
composites in order to limit their range of influence on block grade without
entirely ignoring their high value.
* (5) Dry bulk density was estimated using ID2 from drill core samples
collected throughout the deposit. The density of the Oxide domain was
estimated from hand samples collected from within the open pit as well as
from drill core samples.
* (6) Blocks were classified as indicated or inferred in accordance
with CIM Definition Standards.
* (7) NSR was estimated using diluted grades, metal prices, recoveries
and appropriate smelter terms and downstream costs.
* Grades were diluted to a 5 x 5 x 5m block.
* Metal prices used for copper, zinc, gold and silver were $3.30/lb,
$1.05/lb, $1350/oz and $26/oz respectively.
* Metallurgical recoveries, supported by metallurgical test work were
applied as follows:
1. Oxide zone: recoveries of 88% and 22% were applied for gold and silver
respectively, based on actual production. Copper and zinc are not recovered
during the oxide phase and therefore are not considered a part of the oxide
mineral resources.
2. Supergene zone: recoveries of 88%, 56%, and 54% were applied for
copper, gold and silver respectively. Zinc has not been assigned a recovery
as most of the supergene zone will be processed prior to start-up of the
zinc flotation plant.
3. Hanging wall zone (included in the supergene zone total): recoveries of
88%, 56%, and 54% were applied for copper, gold and silver respectively.
Zinc has not been assigned a metallurgical recovery as most of this zone
will be processed prior to start-up of the zinc flotation plant.
4. Primary zone: recoveries to copper concentrate of 85%, 36%, and 29%,
were applied for copper, gold and silver respectively. Recoveries to zinc
concentrate of 83.5%, 9% and 20% were applied for zinc, gold and silver
respectively. Due to uncertainty whether candidate smelters will pay gold
and silver credits, they have been disregarded for cash flow estimates.
* (8) A Lerchs-Grossman pit shell was generated from the NSR and using
mining costs of $2.08/t, plus $0.01/t/5 m bench for ore and $0.02/t/5 m
bench for waste below the reference elevation of 540 m. The total ore based
costs (process, G&A and stockpile re-handle) are $46.42/t for oxide, and
$35.29/t for supergene and primary rock types. Overall pit slopes used in
the pit optimization varied from 34.5° to 44°.
* (9) Mineral resources were reported within the Lerchs-Grossman pit
shell above an NSR cut-off equivalent to the total ore based costs stated
above. The contained metal figures shown are in situ. No assurance can be
given that the estimated quantities will be produced. All figures have been
rounded to reflect accuracy and to comply with securities regulatory
requirements. Summations within the tables may not agree due to rounding.
* (10) AGP undertook data verification, and reviewed Bisha's quality
assurance and quality control programs on the mineral resource data. AGP
concluded that the collar, survey, assay and lithology data were adequate to
support mineral resources estimation.
Table 6: Harena Mineral Resources Estimate
David Thomas P. Geo., Effective Date May 31, 2012
Indicated
Contained Metal
Zone
NSR Cut-Off
($/t)
Tonnes
('000's)
Copper
%
Zinc
%
Gold
g/t
Silver
g/t
Cu
('000 lbs)
Zn
('000 lbs)
Au
('000 Oz)
Ag
('000 Oz)
Oxide Phase
48.92
220
3.79
-
-
27
-
Primary Phase
37.79
1,850
0.65
3.90
0.56
23
26,510
159,060
33
1,370
Total
26,510
159,060
60
1,370
Inferred
Contained Metal
Zone
Tonnes
('000's)
Copper
%
Zinc
%
Gold
g/t
Silver
g/t
Cu
('000 lbs)
Zn
('000 lbs)
Au
('000 Oz)
Ag
('000 Oz)
Oxide Phase
48.92
40
4.49
-
-
6
-
Primary Phase
37.79
370
0.74
4.06
0.79
32
6,040
33,120
9
380
Total
6,040
33,120
15
380
The following notes should be read in conjunction with table 6 above:
* (1) AMEC undertook data verification, and reviewed Bisha's quality
assurance and quality control programs on the mineral resources data. AMEC
concluded that the collar, survey, assay and lithology data were adequate to
support mineral resources estimation.
* (2) Domains were modeled in 3D to separate oxide, supergene and
primary massive sulphide rock types from surrounding waste rock. The domains
conformed to lithological contacts logged in diamond drill core.
Sub-domaining was further warranted to separate different grade populations
and zones with differing strike and dip orientation within domains.
* (3) Raw drill hole assays were composited to 3.0 m lengths broken at
domain boundaries.
* (4) High grade assays were capped prior to compositing. Capping
thresholds were assessed within each domain independently.
* (5) Block grades for copper, zinc, gold and silver and lead were
estimated from the composites using a combination of ordinary kriging (OK)
and inverse distance weighted to the third power (ID3) into 5 x 5 x 3 m
blocks coded by domain. Grade estimation used only the exploration drill
core dataset as the grade control drilling data was not available at the
time of mineral resources estimation.
* (6) The density of the Oxide domain was assigned from the length
weighted mean of core samples collected from drill holes. Dry bulk density
of the primary sulphide was estimated by a regression of block grade
estimates. The regression was derived from assays of sulphur, barium, iron,
copper, zinc and lead.
* (7) AMEC reviewed the available grade control drill hole data. The
results generally support the grades intercepted in the exploration core
drilling.
* (8) Blocks were classified as indicated and inferred in accordance
with CIM Definition Standards.
* (9) NSR was estimated using undiluted grades, metal prices,
recoveries and appropriate smelter terms and downstream costs.
* (10) Metal prices used for copper, zinc, gold and silver were
$3.30/lb, $1.05/lb, $1350/oz, and $26/oz respectively.
* (11) Metallurgical recoveries, supported by metallurgical test work
were applied as follows:
1. Oxide zone: a recovery of 75% was applied for gold. No metallurgical
test work was completed to support a recovery for silver. Copper and zinc
are not recovered during the oxide phase and therefore are not considered a
part of the oxide mineral resources.
2. Supergene zone: No recoveries were assigned as preliminary
metallurgical test work was considered insufficient to support
classification of the material as part of the mineral resources. With
further metallurgical test work, the potential exists to add this 100kt to
150kt of material to the mineral resources.
3. Primary zone: recoveries to copper concentrate of 85%, 36%, and 29%,
were applied for copper, gold and silver respectively. A recovery to zinc
concentrate of 72%, was applied for zinc.
* (12) A Lerchs-Grossman pit shell was generated from the NSR and
using mining costs of $2.08/t. Ore based costs include $2.50/t for overland
ore haulage. The total ore based costs (process, G&A and stockpile
re-handle) are $48.92/t for oxide, and $37.79/t for the primary rock type.
Overall pit slopes used in the pit optimization varied from 29° to 35.5°.
* (13) Mineral resources were reported within the Lerchs-Grossman pit
shell above an NSR cut-off equivalent to the total ore based costs stated
above. The contained metal figures shown are in situ. No assurance can be
given that the estimated quantities will be produced. All figures have been
rounded to reflect accuracy and to comply with securities regulatory
requirements. Summations within the tables may not agree due to rounding.
Table 7: Combined Bisha and Harena Mineral Resources Estimate
Michael Waldegger, P.Geo. (Bisha) and David Thomas P. Geo. (Harena),
Effective Date: May 31, 2012
Indicated
Contained Metal
Zone
Tonnes
('000's)
Copper
%
Zinc
%
Gold
g/t
Silver
g/t
Cu
('000 lbs)
Zn
('000 lbs)
Au
('000 Oz)
Ag
('000 Oz)
Oxide Phase
960
5.56
33
-
-
172
1,020
Supergene Phase
8,000
3.75
0.72
28
661,390
-
185
7,200
Primary Phase
23,000
0.94
6.26
0.70
45
474,140
3,175,870
516
33,330
Total
1,135,530
3,175,870
873
41,550
Inferred
Contained Metal
Zone
Tonnes
('000's)
Copper
%
Zinc
%
Gold
g/t
Silver
g/t
Cu
('000 lbs)
Zn
('000 lbs)
Au
('000 Oz)
Ag
('000 Oz)
Oxide Phase
370
5.22
99
-
-
62
1,180
Supergene Phase
300
1.73
0.19
5
11,440
-
2
50
Primary Phase
1,370
0.97
8.09
0.77
52
29,410
244,320
33
2,280
Total
40,850
244,320
97
3,510
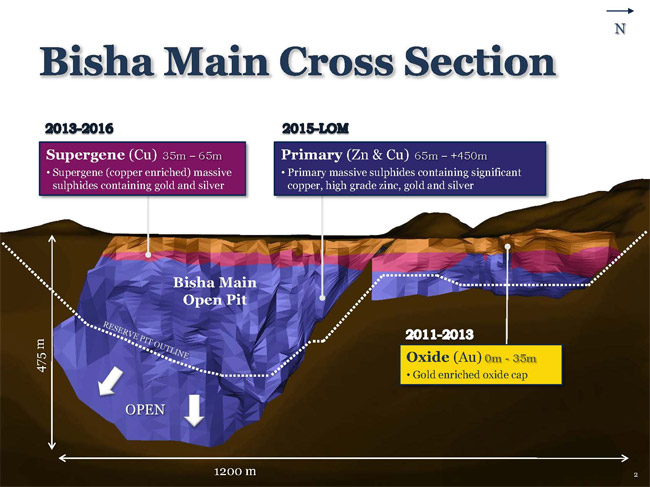
Figure 1 - Cross Section of Bisha Main Zones
http://www.nevsun.com/news/2012/july24/Bisha-Main-Cross-Section.jpg
Gold reserves are contained primarily in an oxide ore zone and base metals
reserves are contained in supergene and primary sulphide zones which
underlie the gold oxide. See Figure 1 above for an illustration of the
zones. The adjusted mine plan anticipates the Bisha Main pit extending to a
depth of 290 meters below surface, 30 meters deeper than the previous
ultimate pit and incorporates an additional pit 115 meters deep at Harena,
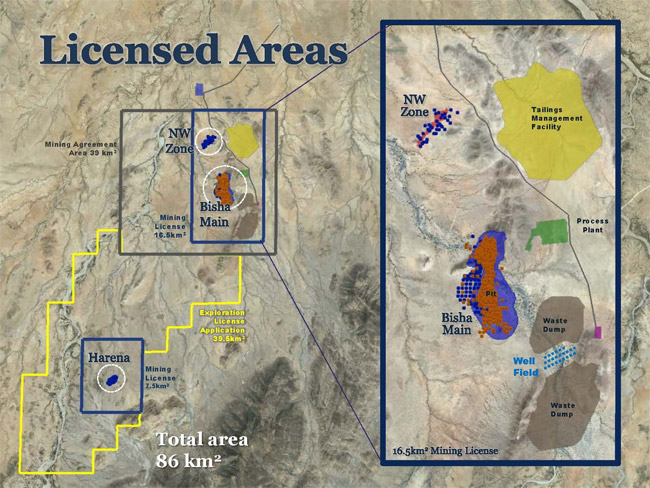
which is located 9 kilometers from Bisha Main. See Figure 2 below for a map
of the licensed areas.
Figure 2 - Bisha Mine Licensed Areas
http://www.nevsun.com/news/2012/july24/Bisha-Main-Licensed-Areas.jpg
Received on Tue Jul 24 2012 - 14:50:05 EDT
