
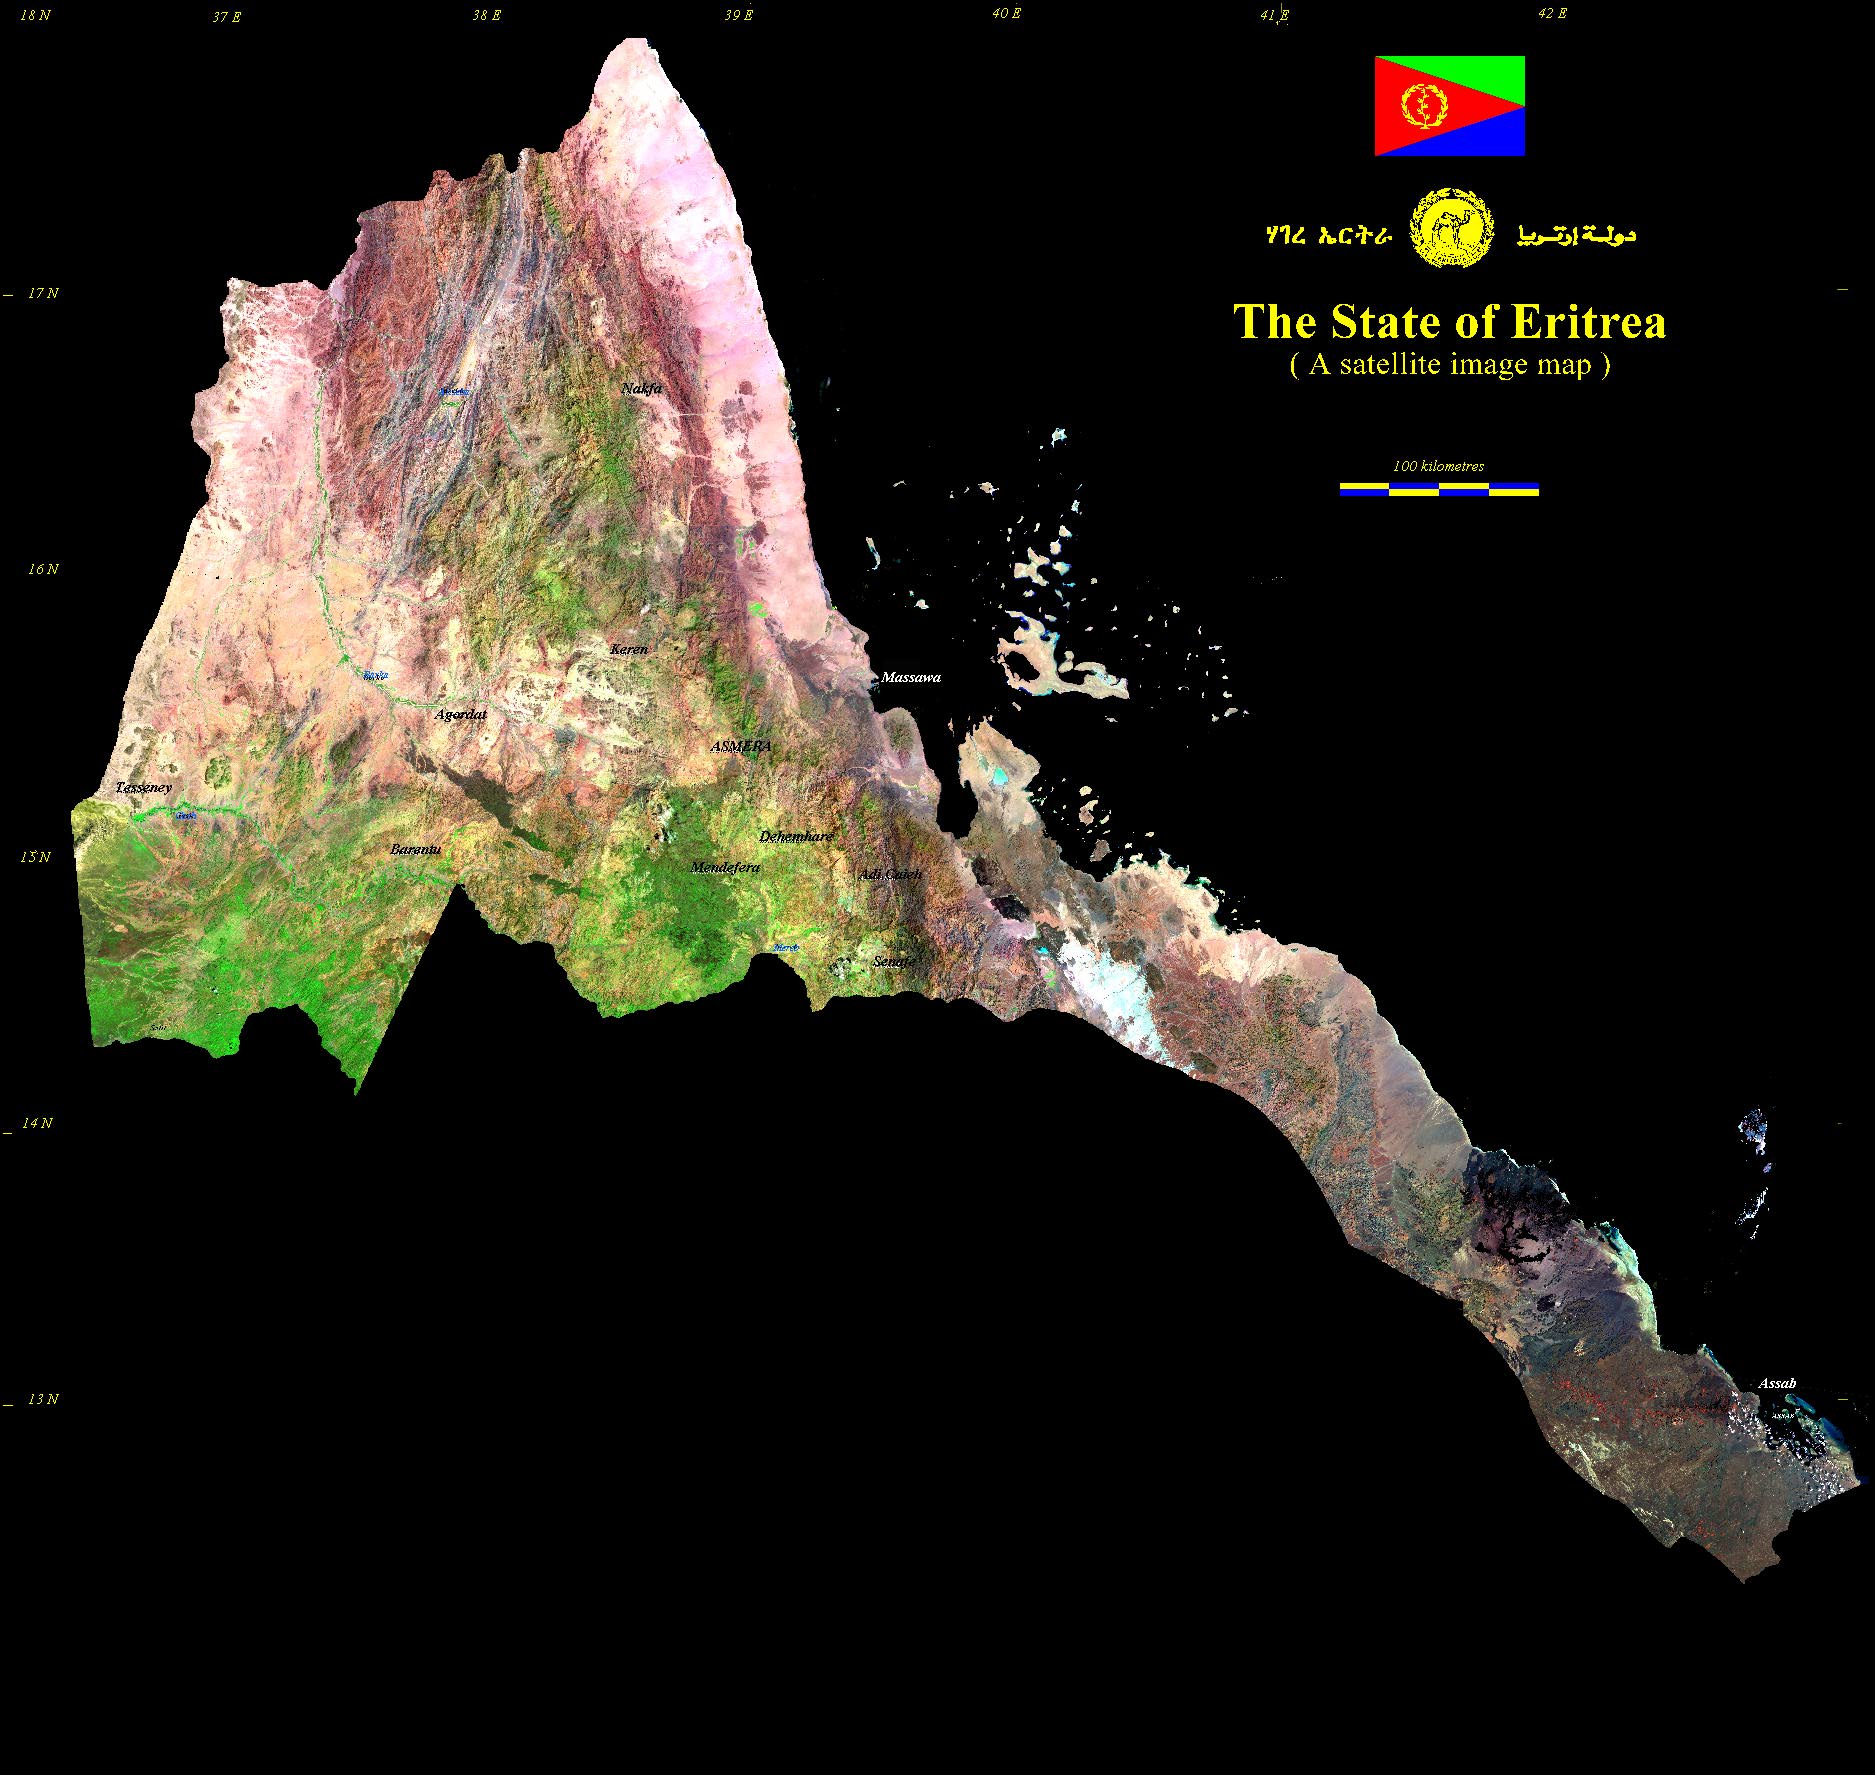
Satellite Image Map of Eritrea.
Contributed by Steve A. Drury
 Full Image: ~375Kb
Figure Legend.
The satellite image map was produced during work with the Department of Mines
and Water Resources Department in Asmara over a period of about 18 months,
from images purchased by the Eritrean Interagency Consortium (EIAC) and by
the Open University. Special thanks go to Martine Bilanou (Letense) formerly
of EIAC, Haile Woldetensae of WRD Asmara, Dick Carlton of the Open University
UK, and Beto de Souza of the University of Campinas in Brazil, for support,
advice and assistance.
It is made from 12 Landsat Thematic Mapper images, and uses data from two
infrared channels (Bands 7 and 4) that detect clay minerals and vegetation,
and visible blue light. They make up the red, green and blue parts of the
colour images, so explaining why vegetation looks green and the bare surface
is much more colourful than in ordinary visible light. The full image is
very useful for making inventories of vegetation, soild, rock types,
underground water, and topography. A preliminary 1:1million scale print is
available from Ghebremichael Temnewo ofMinistry of Land, Water and
Environment, Water Resources Department, PO Box 1488, Asmara, for US$20. A
reprint using the version here is planned. Proceeds from sale are intended
for a variety of charitable causes in Eritrea. You should make enquiries
about availability to Ghebremichael Temnewo on fax 291-1 124625.
Steve Drury, Oct. 1997.
 Full image: ~215kb
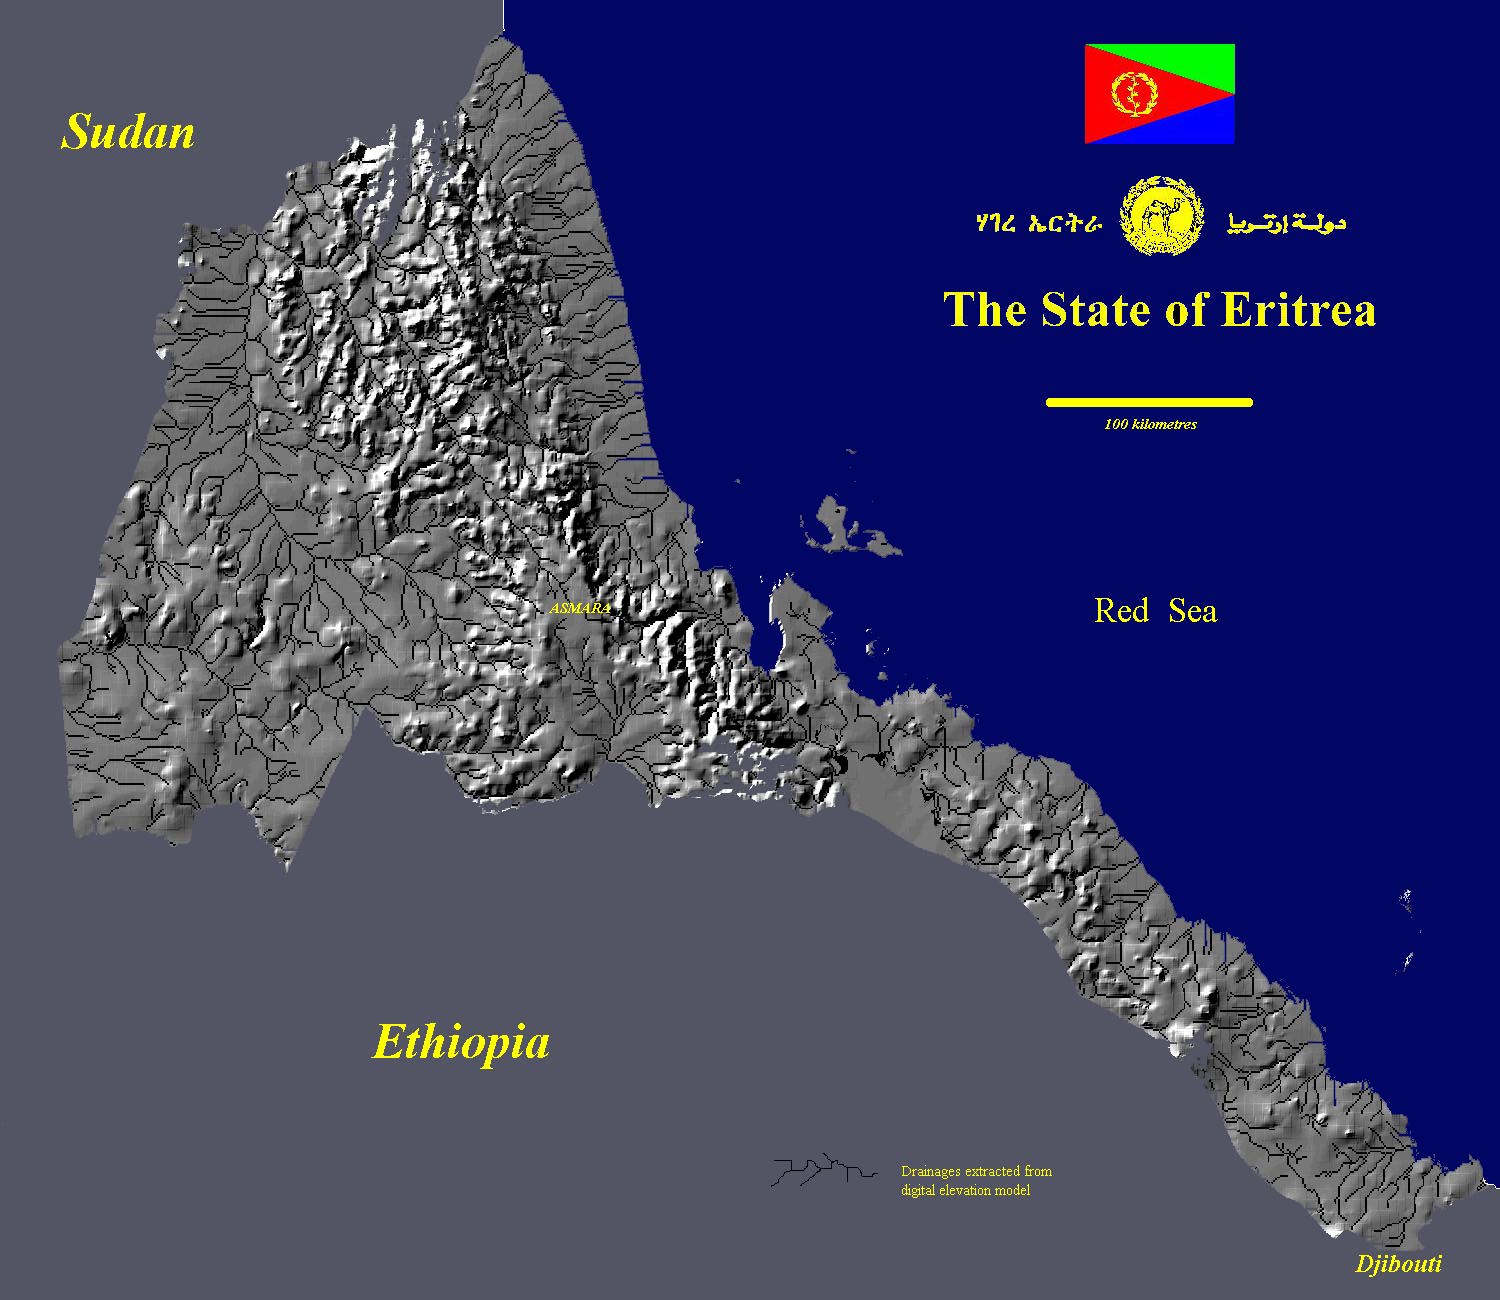
Figure Legend.
This map was compiled by computer analysis of the ETOPO5 30 arc second (1
kilometre grid) data, which comprise topographic elevation values derived
from published topographic maps of the world. I extracted the area of NE
Africa containing Eritrea and used the image map to mask out bordering areas
to emphasize Eritrea. The next step was to simulate the topography as if it
was illuminated by lighting from the north-west (a standard procedure for
cartographic presentation). The drainages are simulated by following the
downhill path that water falling on every element of the topography would
take. Neither the topography nor the drainages are accurate, because of the
coarse resolution of the data (averaged for every square kilometre).
Drainages are wrong for the area around the Danakil Depression, because the
modelling assumes all water flows to sea level and the stops, and of course
the Danakil Depression is below sea level. However, all the main geographic
features are shown, including the basins of the Tekessie/Setit, Mereb/Gash,
Barka and Anseba rivers.
Steve Drury, Oct. 1997.
 Full image: ~215kb